Improved Visibility for Smarter Water Treatment

Unify your data, uncover trends, and make proactive decisions with Aliquot’s real-time insights.


Improved Visibility

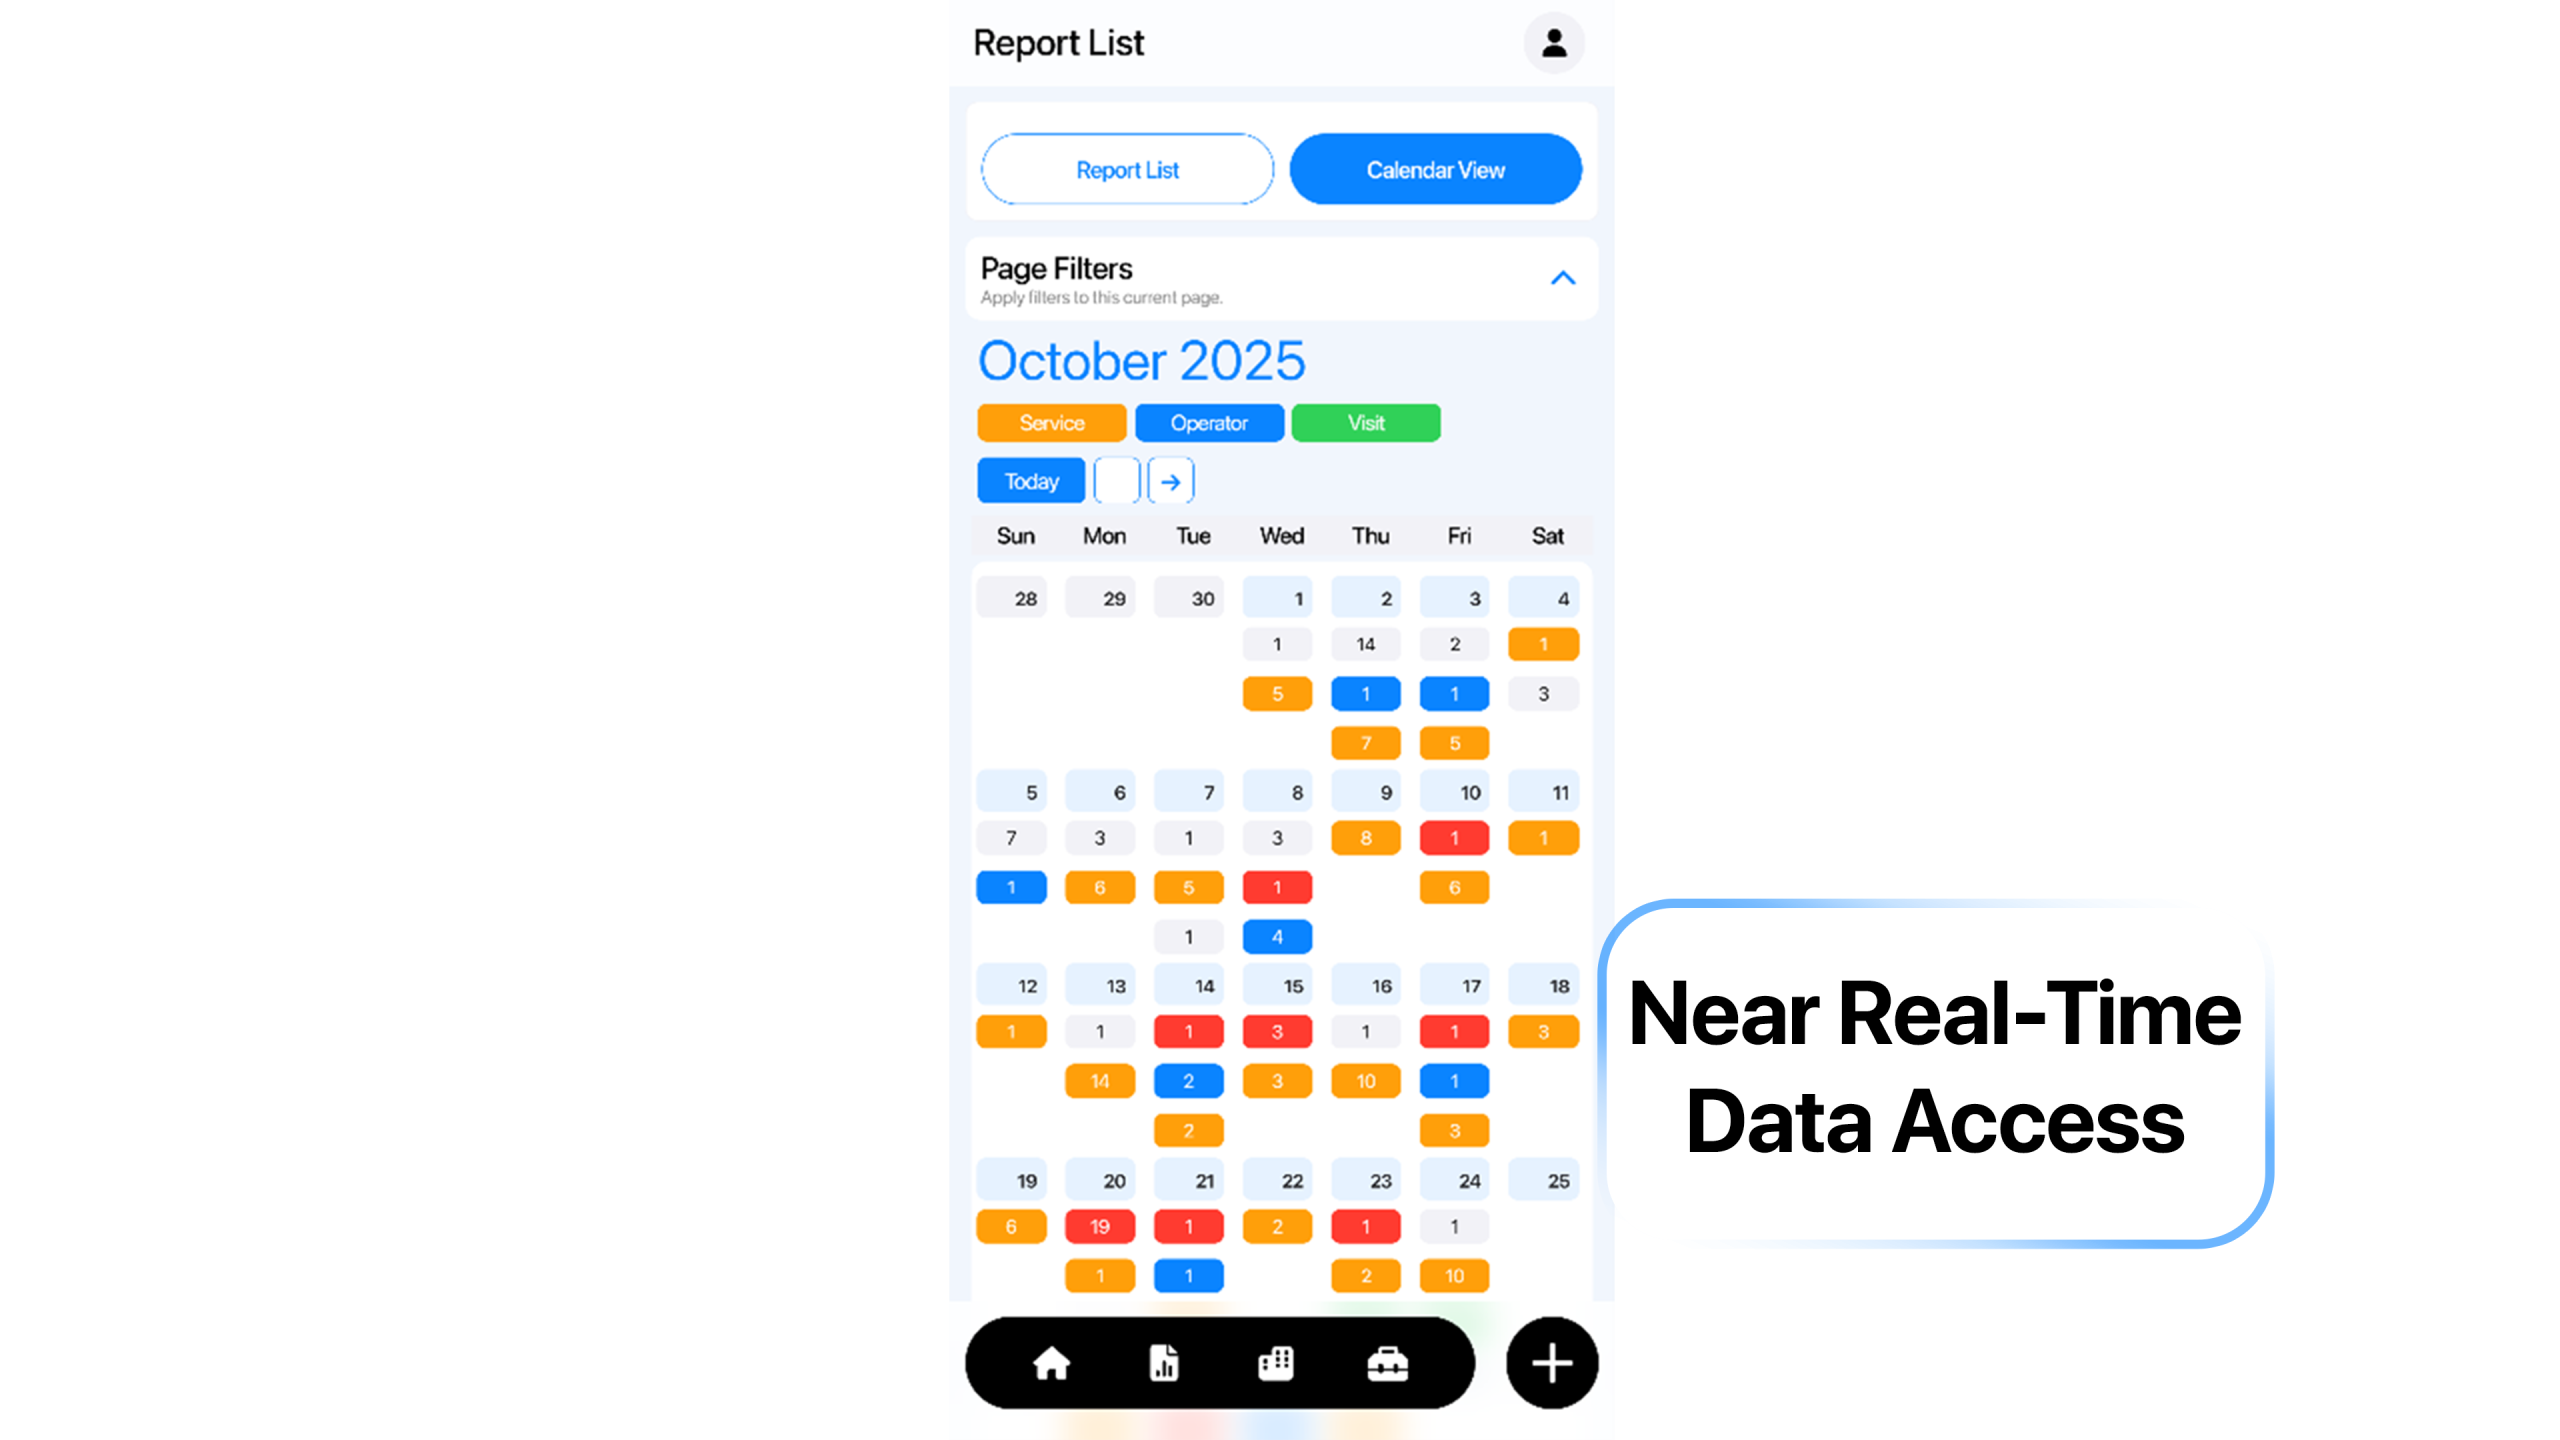
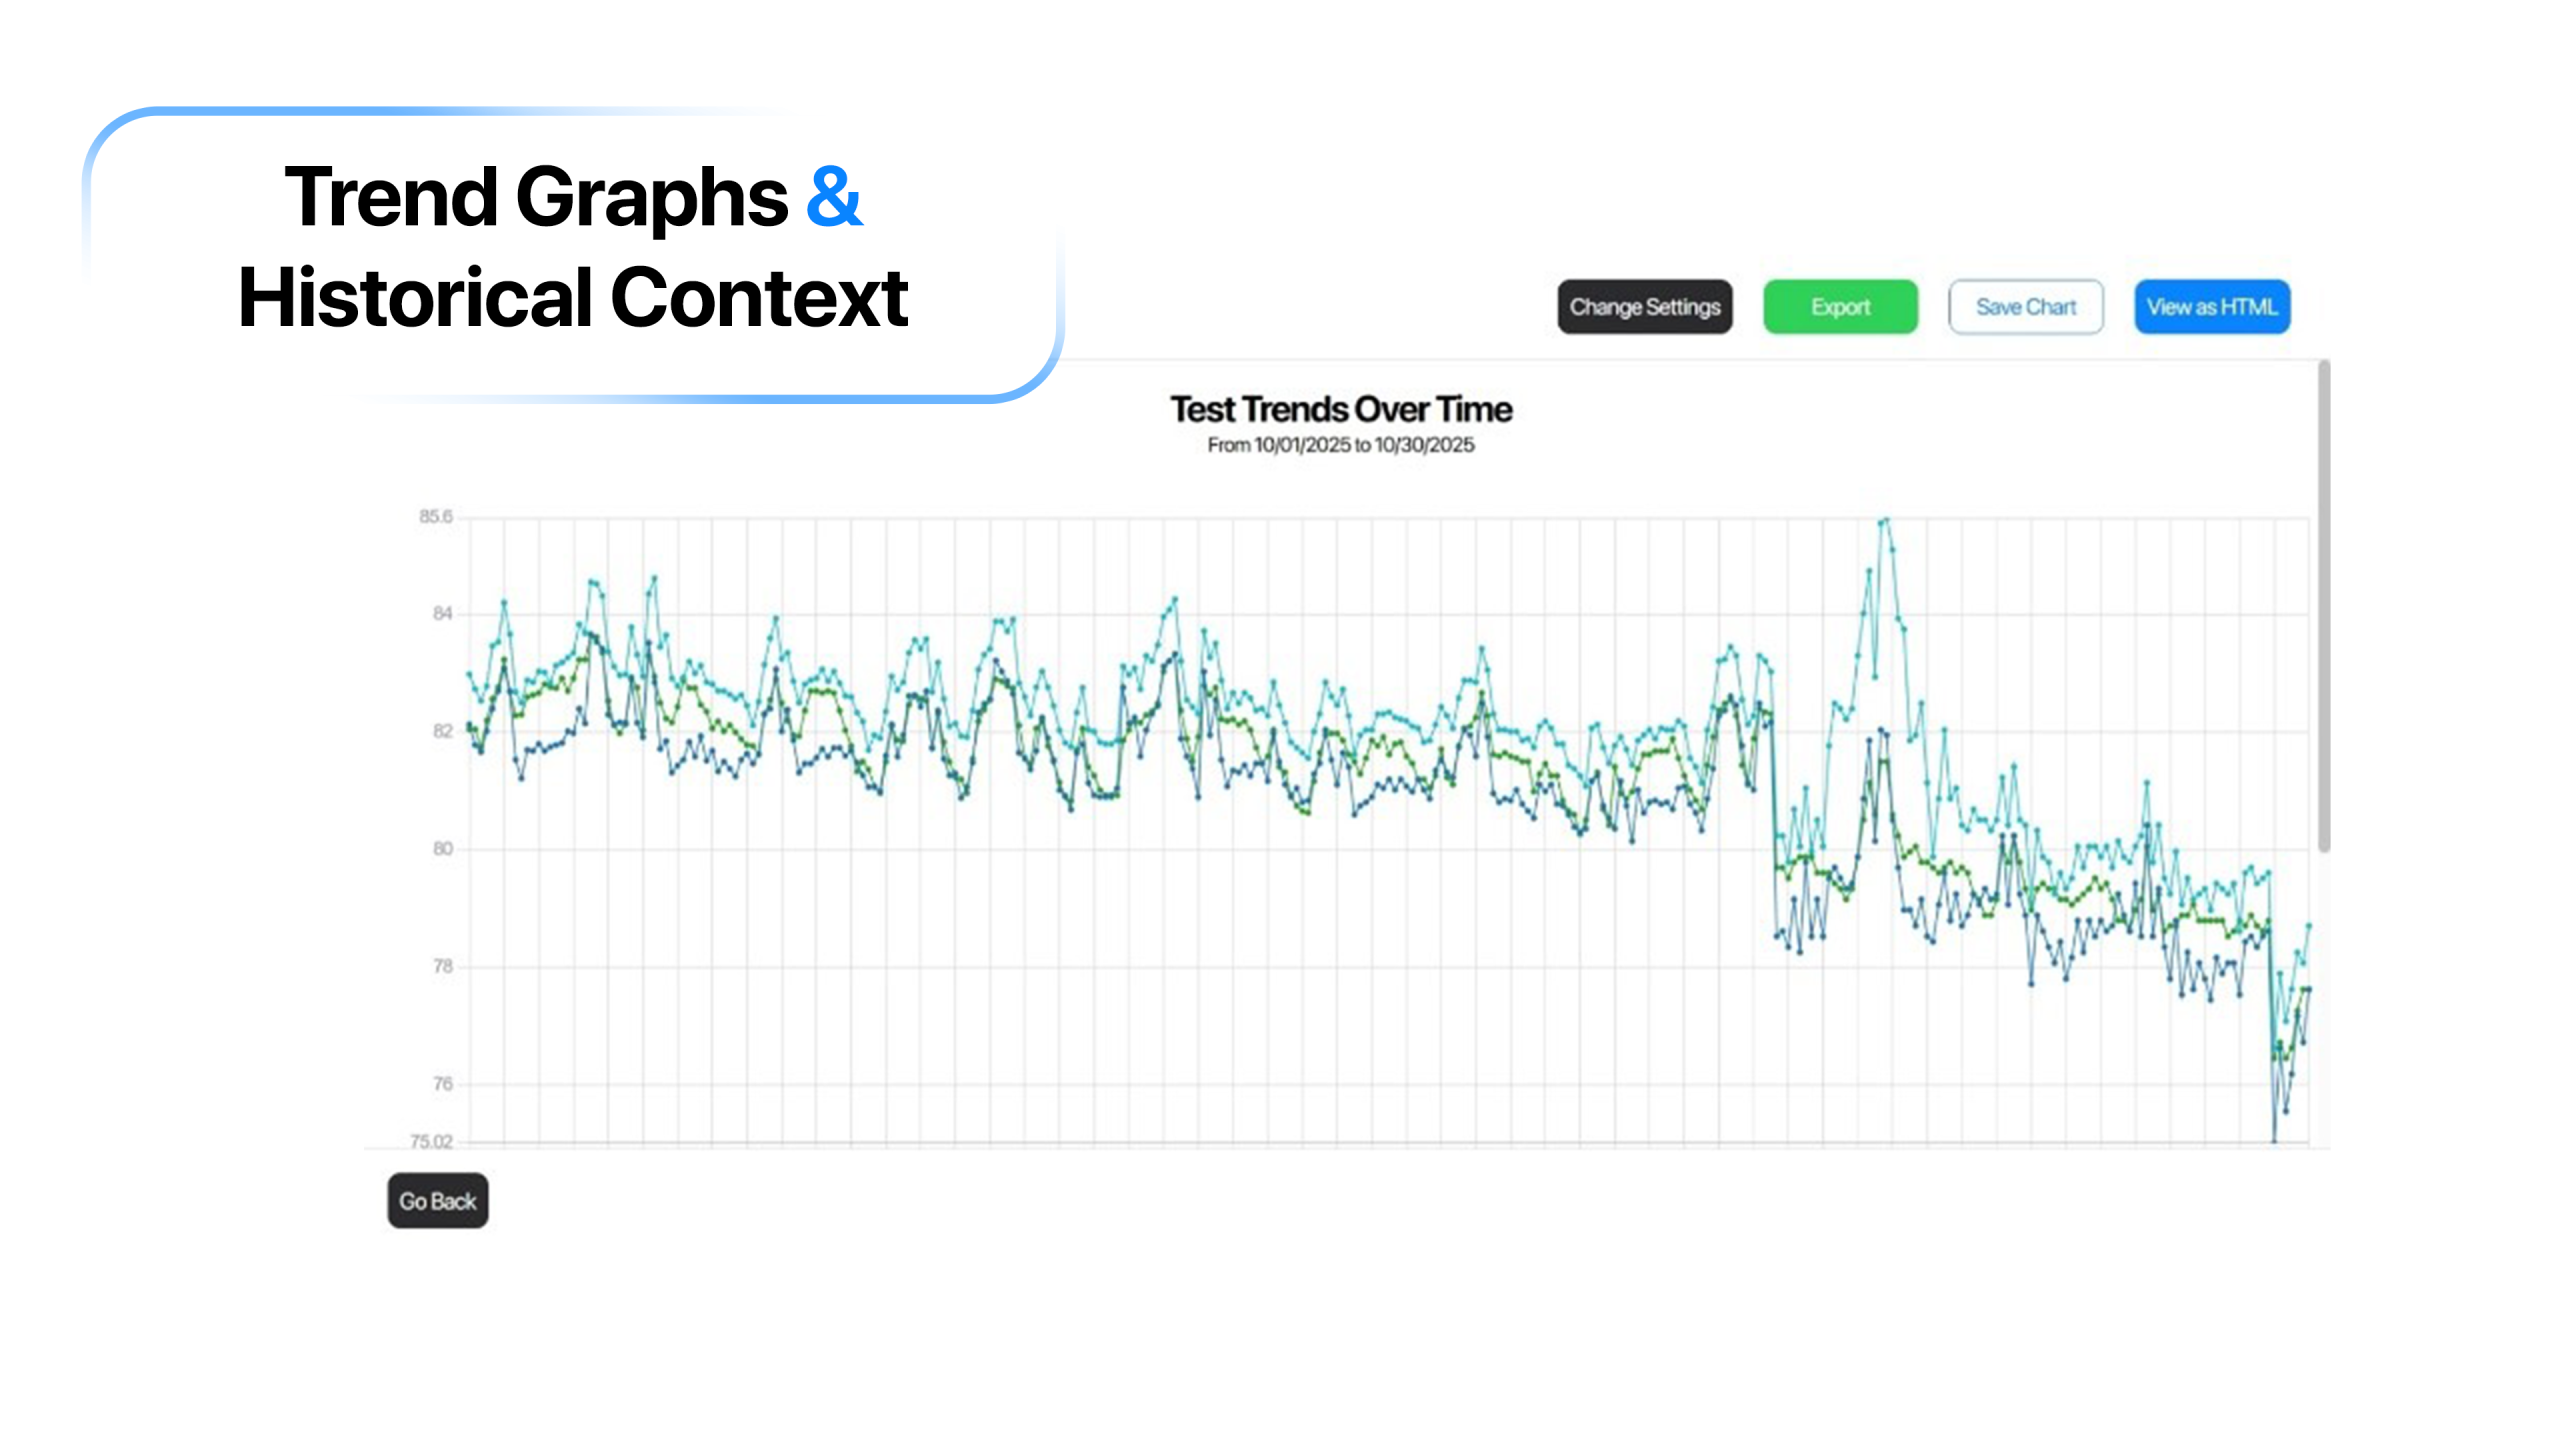
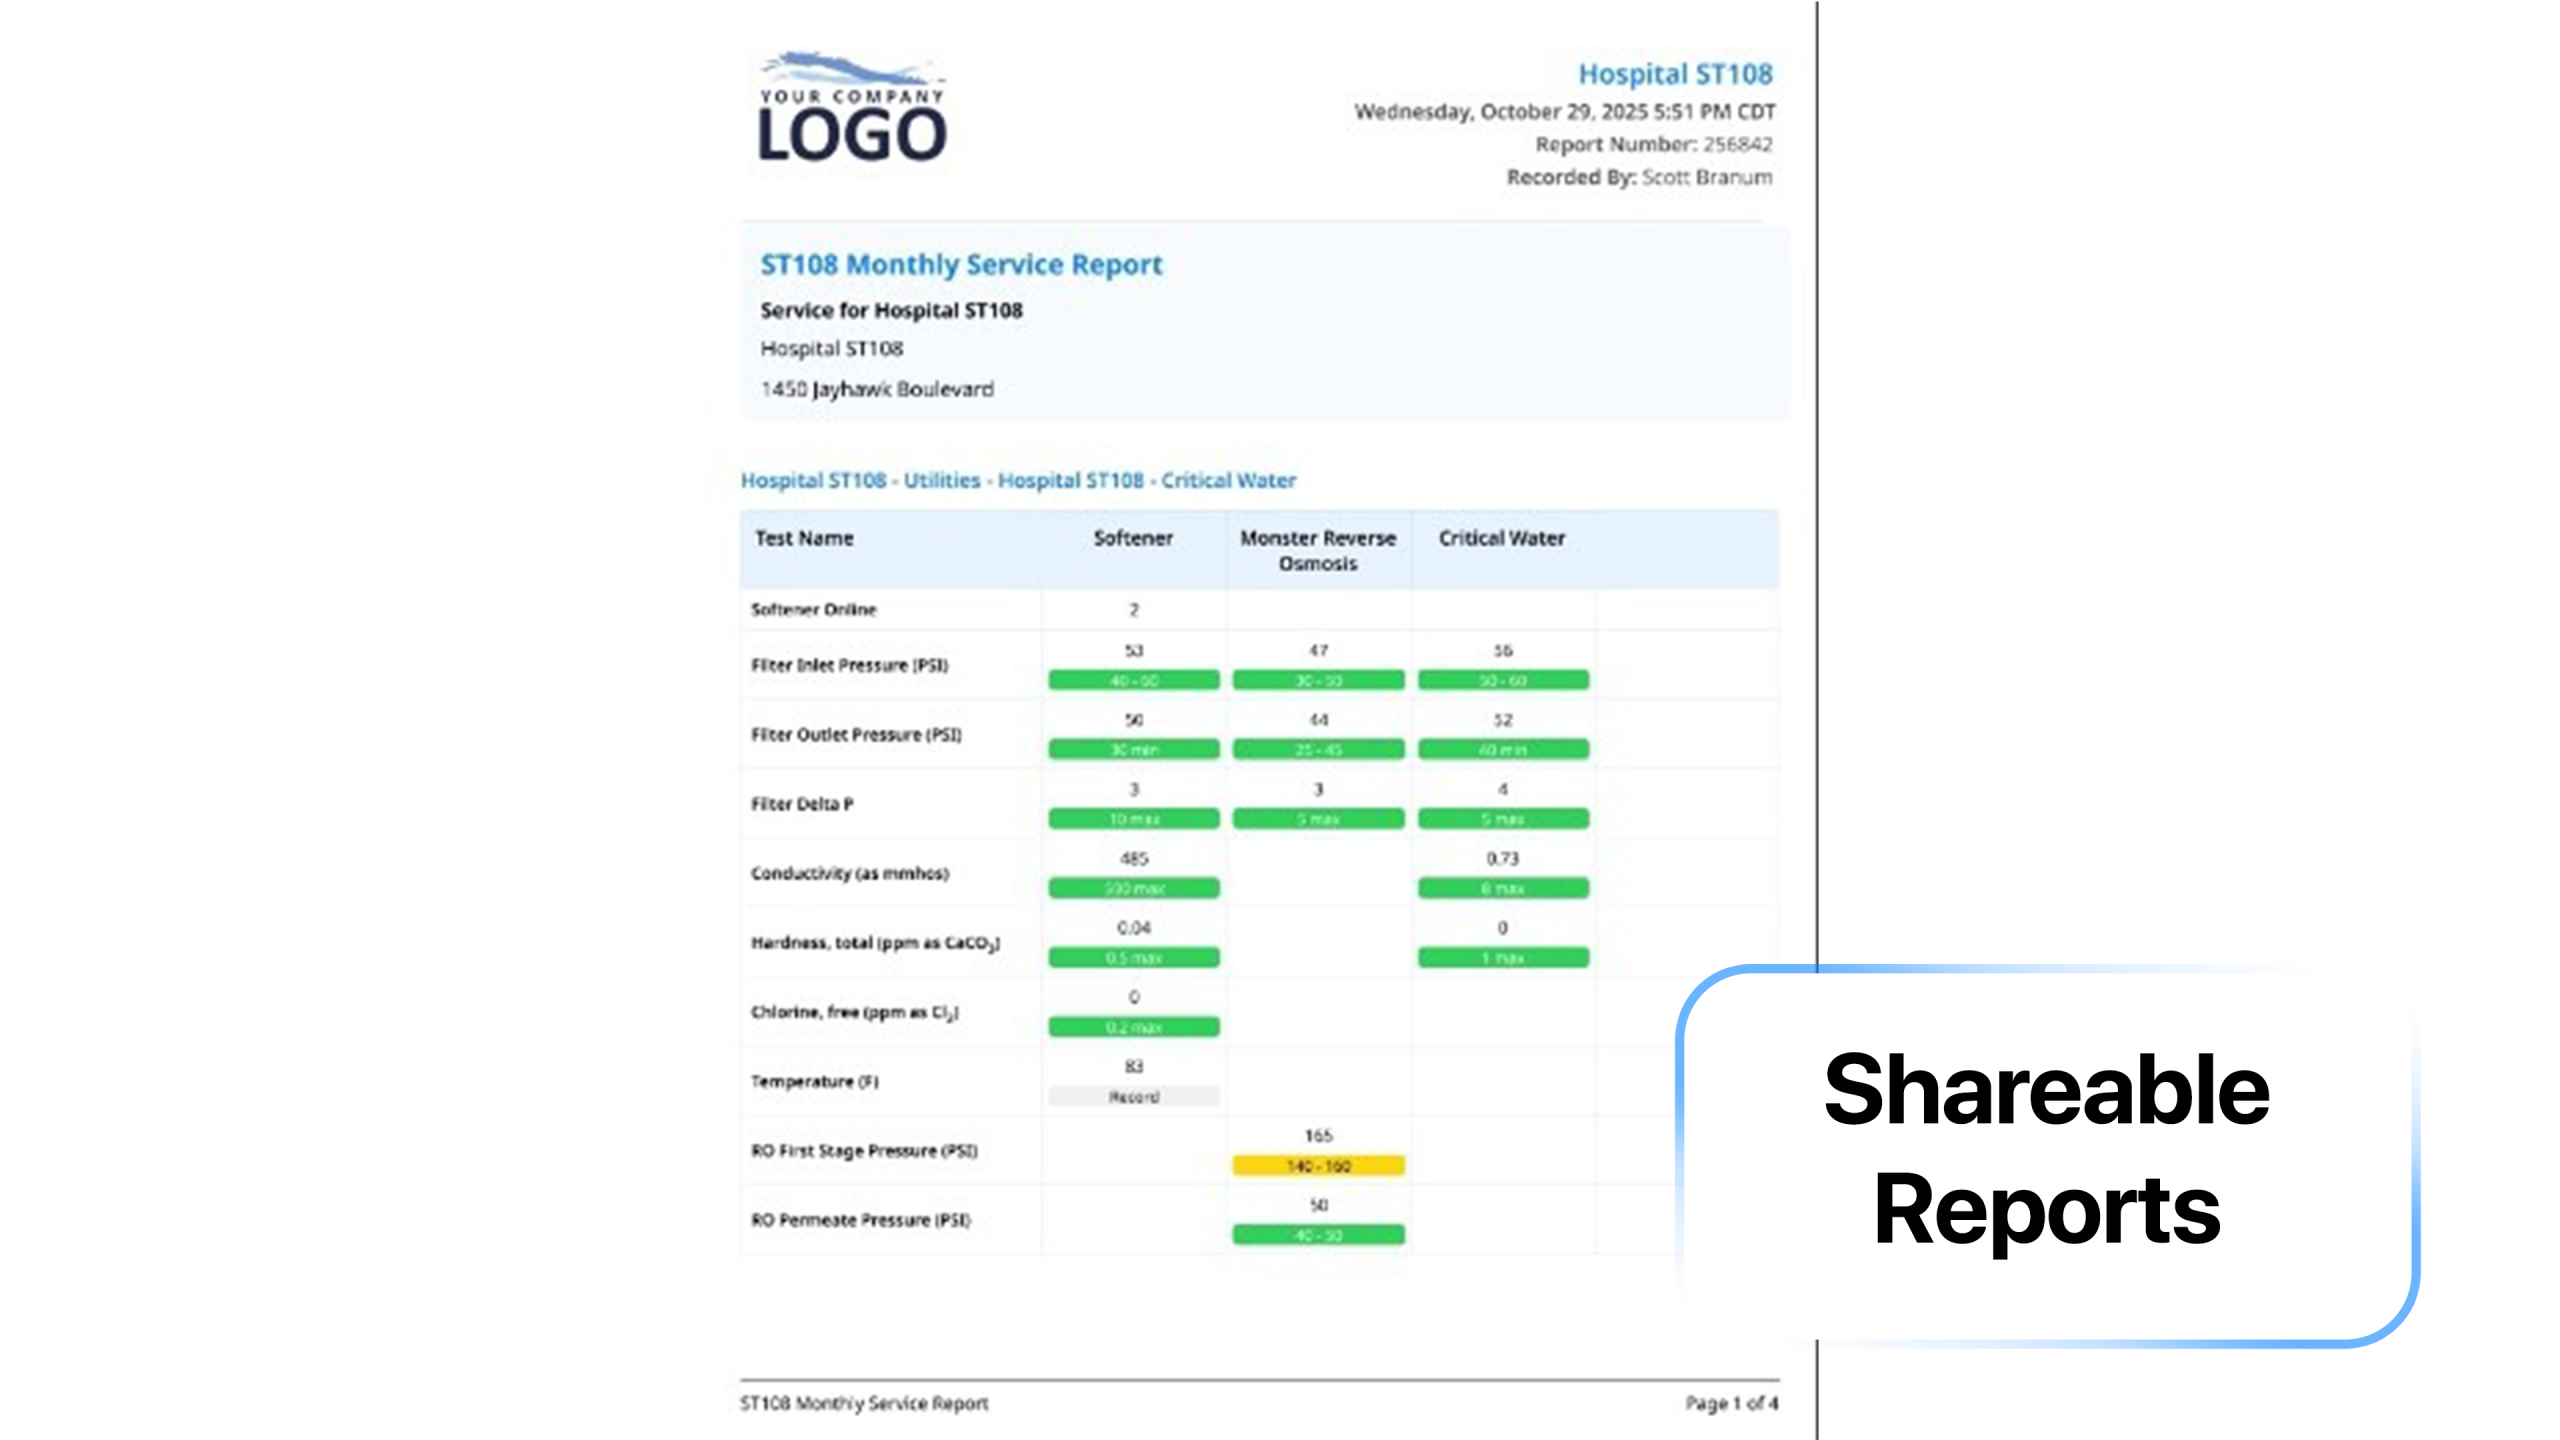
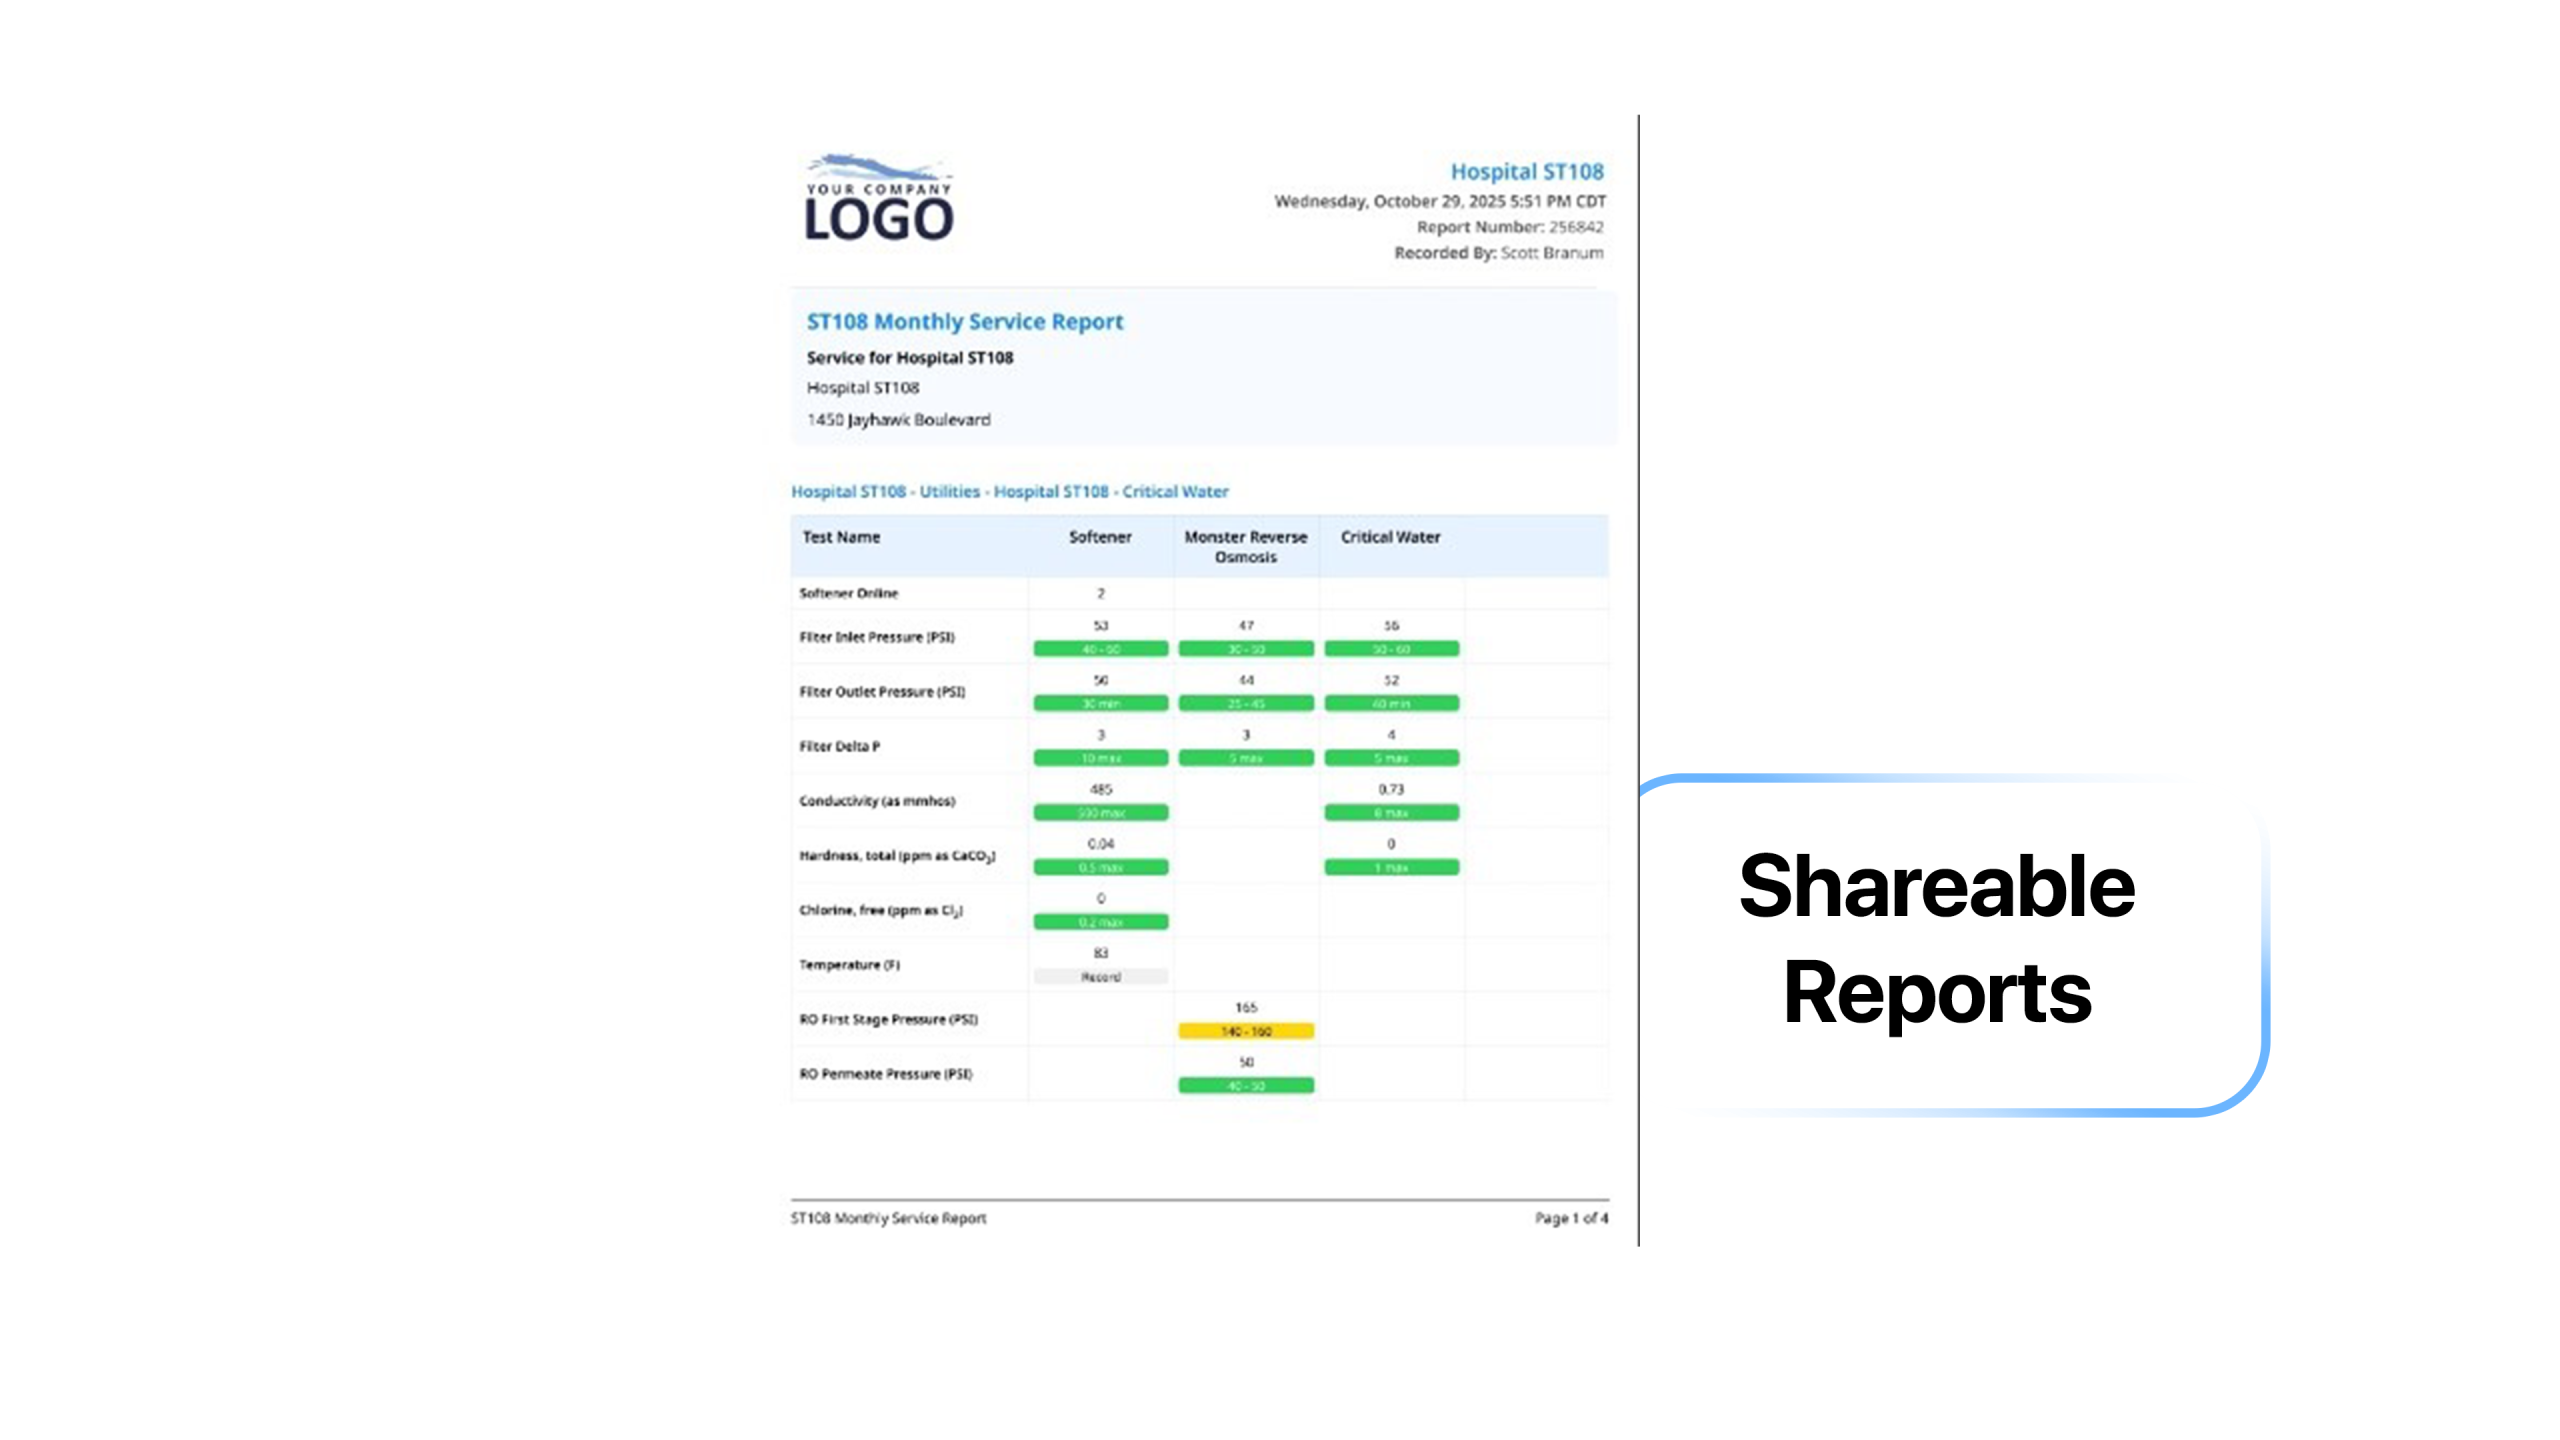
Aliquot gives water-treatment teams a clear, unified view into their entire operation. Instead of fragmented notes and scattered data points, you get access to test results, controller readings, and historical trends in one place. That visibility empowers you to analyze performance over time, identify patterns, and make informed decisions, not just react on the fly.

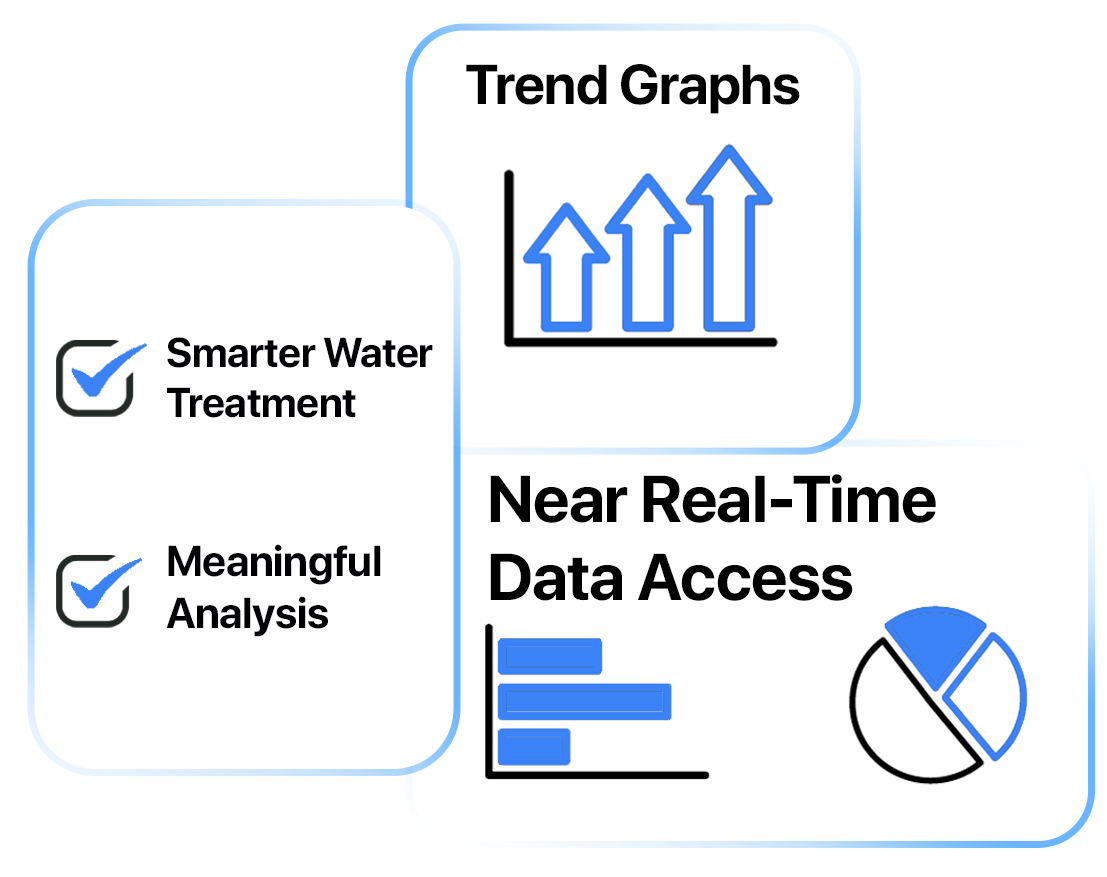
Insights & Visibility Highlights

Near Real-Time Data Access: View near real time readings from on-site controllers and field tests as soon as they’re entered, so you always know where systems stand.

Trend Graphs & Historical Context: Aliquot graphs previous reading from hours, days, weeks, months, or years – helping you see spikes or trends over time.

Shareable Reports: Generate reports with comments, trend visualizations, and annotated analysis, then send them to customers or stakeholders to highlight system health and service value.

Automated Alerts & Notifications: Set up notifications for out-of-range readings or inventory thresholds, so issues don’t go unnoticed, and you can react before things become a problem.

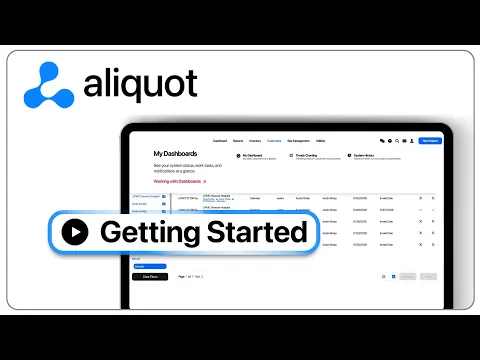
Your Aliquot Video Tour Starts Here

Why That Visibility Matters

When your team has deeper insight into system performance, operations shift from reactive to deliberate. Instead of scrambling to put out fires, you can proactively adjust treatment strategies, anticipate supply needs, and optimize site visits. Having the data all in one place helps you spot inefficiencies, establish patterns, and build a stronger case for recommendations. For customers, it means you can back up your visits with meaningful analysis, not just a checklist. That level of clarity also supports long-term planning: you’ll know which sites need more frequent attention, which chemicals are being overused, and where potential risks could emerge.