The Application of Oxidants in Seawater
November 2021
Seawater Disinfection
The disinfection of seawater is required for numerous applications, including desalination, ballast water, aquaculture, seawater pools/spas, and in cooling towers. Each application has specific considerations that are best met by a particular disinfectant, usually an oxidant. The oxidants include chlorine, bromine, chlorine dioxide, ozone, peracetic acid, hydrogen peroxide, ultraviolet light and advanced oxidation. In some cases, adding more than one oxidant, sometimes in a particular sequence, is most effective. To determine the most effective procedure for deactivating organisms of interest, empirical studies are required that vary the oxidizer, the concentration of the oxidant, and the contact time. Seawater presents a unique challenge for disinfection due to the production of unintended disinfection byproducts (DBP).
In seawater, secondary oxidants are often produced that have different characteristics than the primary oxidant. Chlorine, ozone and peracetic acid oxidize the bromide ions in seawater to bromine, which is also an oxidant. If free ammonia is present in the seawater, chlorine and bromine will form chloramines and bromamines, which are also oxidants. Peracetic acid (PAA) maintains an equilibrium with hydrogen peroxide, which is also an oxidant. If more than one oxidant is present in seawater, the disinfecting capability will be a function of all of them. Since it can be difficult to distinguish the individual concentrations of oxidizers in the same seawater solution, a parameter called the Total Residual Oxidant (TRO) concentration is often used. However, this parameter can only give the approximate disinfecting power of a solution unless empirical studies are done. The TRO concentration is typically measured by a colorimetric method, oxidation reduction potential (ORP), or amperometry.

Total Residual Oxidant Measurement Methods
The most commonly used colorimetric method for measuring TRO is based on the color producing compound N,N-diethyl-p-phenylenediamine (DPD). The reagent contains DPD, potassium iodide and a neutral buffer. Oxidants either react directly with DPD or with iodide ions to form iodine which then reacts with DPD. The oxidant hydrogen peroxide also requires a molybdate catalyst to increase the reaction rate with iodide ions. The oxidized form of DPD, known as Wurster dye, is pink. However, DPD can be oxidized further to a colorless form (1).
Since there is no TRO standard available for calibration, the DPD test used to measure TRO is calibrated with standard chlorine solutions, and TRO is consequently often expressed in units of mg/L Cl2. DPD tests calibrated for other oxidants, such as bromine, ozone, peracetic acid, etc. may theoretically be converted to mg/L chlorine by multiplying the measured oxidant concentration by the following chlorine to oxidant molecular weight ratios. Calibrations generated for other oxidants may deviate from the molecular weight ratios.
MW Cl2/MW Br2 = 70.9/159.8 = 0.444 mg/L Cl2 per 1 mg/L Br2
MW Cl2/MW O3 = 70.9/48 = 1.477 mg/L Cl2 per 1 mg/L O3
MW Cl2/MW PAA = 70.9/76.05 = 0.932 mg/L Cl2 per 1 mg/L PAA
While DPD tests will accurately determine the TRO concentration of seawater treated with ozone, colorimetric ozone tests that employ the indigo trisulfonate chemistry should not be used to measure the TRO concentration of ozone-treated seawater. The reaction of indigo trisulfonate with the bromine formed in seawater as a result of ozone treatment is slow, and for commercial ozone tests, it is further inhibited by the addition of malonic acid (typically used to prevent chlorine interference).
In the ORP electrode method the voltage difference between a platinum electrode and a reference electrode is measured in a solution. The platinum electrode spontaneously gives up electrons to an oxidant in solution until a surface charge builds up that is equal to the ORP of the solution in units of millivolt (mV). The ORP of the solution is a function of the equilibrium redox reactions of the oxidants as described by the Nernst equation. The ORP response is logarithmic, so each 10-fold increase in the oxidant changes the ORP by -59.16 mV per electron transferred. For the hydrolysis of chlorine,
Cl2 + H2O ⇌ HClO + H+ + Cl–
two electrons are transferred; Cl2 (oxidation state 0) transfers one electron to HClO (oxidation state +1) and accepts one electron to Cl– (oxidation state -1). Therefore, the potential of the solution changes by -29.6 mV for each 10-fold change in Cl2 concentration. The ORP will be sensitive to the concentration change of any ions that are part of the redox reaction, for example H+ and Cl– for chlorine hydrolysis. However, in seawater the pH is buffered by carbonate, and the chloride concentration is large enough so that it is not sensitive to small variations. The reference ORP electrode is also a significant source of variability because the baseline ORP value with no oxidant added may vary significantly between sources of coastal seawater.
In the amperometric electrode method, a voltage difference is applied between two electrodes that is large enough to cause the oxidants in solution to be reduced at the surface of one of the electrodes. This causes a current to flow between the electrodes that is proportional to the total concentration of all the oxidants being reduced. The response is linear and therefore more sensitive than ORP. Also, the reference electrode is not a significant source of variability since the flow of current is zero without the addition of an oxidant regardless of the source of seawater.
TRO analyzers are commercially available that use the colorimetric DPD method (Watts) or electrode methods (Thermo Scientific Orion). Also, test kits are available for measuring discrete samples by the colorimetric DPD method.
Oxidation Chemistry in Seawater
The characteristic of an oxidant that makes it a good disinfectant is its tendency to change the oxidation state of another chemical, a reductant, by accepting one or more electrons. This is called a redox reaction. In the oxidant, the oxidation state of an atom decreases and in the reductant it increases. The energy change from the oxidized state to the reduced state is the change in oxidation potential, which is in units of voltage since it involves the flow of electrons. The oxidation potential is a measure of the tendency of an oxidant to accept electrons. Generally, the larger the oxidation potential the stronger the oxidant. The oxidation potentials of some oxidants (at standard conditions) commonly used for disinfection are given in Table 1.
Table 1
| Oxidant | Reduced form | Oxidation Potential (V) |
| Hydroxyl Radical (OH*) | OH– | 2.8 |
| Ozone (O3) | H2O | 2.07 |
| Peracetic acid (CH3COOOH) | CH3COOH | 1.81 |
| Hydrogen Peroxide (H2O2) | H2O | 1.78 |
| Hypochlorous acid (HOCl) | Cl- | 1.48 |
| Chlorine gas (Cl2) | Cl– | 1.36 |
| Hypobromous acid (HOBr) | Br- | 1.33 |
| Bromine gas (Br) | Br– | 1.09 |
| Hypoiodous acid (HOI) | I- | 0.99 |
| Chlorine dioxide (ClO2) | ClO2– | 0.95 |
| Iodine gas (I2) | I– | 0.54 |
If organic matter is present in seawater, the oxidant may produce harmful organic disinfection byproducts some of which are regulated. If the DBP contains a halogen (chlorine, bromine or iodine) it is called a halo-DBP. While many hundreds of DBPs have been identified, those that are currently regulated in the U.S. include the trihalomethanes (THM), the haloacetic acids (HAA), bromate (BrO3–), chlorite (ClO2–) and in California and Massachusetts, N-nitrosodimethylamine (NDMA). The maximum contaminant limits (MCL) for these DBPs issued by the U.S. Environmental Protection Agency or state environmental protection agencies are shown in Table 2.
Table 2
MCLs of DBPs currently regulated in the U.S.*
| DBP | MCL (µg/L) |
| THM | 80 |
| HAA | 60 |
| Bromate | 10 |
| Chlorite | 1000 |
| NDMA | 0.01 |
*Stage 2 of the D/DBP Rule (2006)
The World Health Organization (WHO) also has recommended limits for certain DPBs. In freshwater where chloride is often present in significant concentration and bromide is in very low concentration, chlorine DBPs predominate, whereas in seawater where bromide is in significant concentration, bromine DBPs predominate. Bromine DBPs (and iodine DBPs) tend to be more cytotoxic and genotoxic than their chlorine DBP analogues (2).
Chlorine /Bromine
Chlorine (Cl2) added to seawater hydrolyzes to form hypochlorous acid,
Cl2 + H2O ⇌ HClO + H+ + Cl–,
which dissociates to form hypochlorite,
HClO ⇌ ClO– + H+.
The acid form is the stronger disinfectant. However, with a pKa of 7.53, the predominant form in seawater (pH 8.3) is ClO–. Despite hydrolysis, free chlorine concentration is generally expressed as mg/L Cl2 or ppm Cl2. The hydrolyzed forms of chlorine react with the bromide ions, Br–, in seawater to form hypobromous acid, HBrO and hypobromite, BrO–,
HClO/OCl + Br– ⇌ HBrO/BrO– + Cl–.
With a pKa of 8.65 HBrO is the predominant form in seawater. If free ammonia is present these oxidants form chloramine
NH3 + HClO ⇌ NH2Cl +H2O
and bromamine
NH3 + HBrO ⇌ NH2Br +H2O,
which are also oxidants. Furthermore, chlorite is formed by the reaction of two molecules of hypochlorite,
ClO– + ClO– ⇌ ClO2– + Cl–,
and chlorate is produced by the reaction of hypochlorite with chlorite.
ClO2– + ClO– ⇌ ClO3– + Cl–
Both chlorite and chlorate react with DPD (1). Analogous reactions produce bromite (BrO2–) and bromate (BrO3–). All the oxidants will contribute to the TRO concentration measured by the DPD method. The oxidants may react with natural organic matter in seawater to produce DBPs that include THMs, HAAs, halophenols and haloacetonitriles (3). These DPBs are not oxidants.
Chlorine Dioxide
The behavior of chlorine dioxide (ClO2) differs from other chlorine oxidants because it is a radical, having an unpaired valence electron. It is gas at room temperature that is very soluble in water but does not hydrolyze. It does not react with chloride or bromide ions to produce chlorine or bromine, nor does it produce organic DBPs or destroy organic matter. Chlorine dioxide disinfects by reacting with molecules containing amines like amino acids, RNA and proteins, and it can pass through cell walls as a dissolved gas (Lenntech). Residual chlorite may be introduced with chlorine dioxide because it is often used in chlorine dioxide generators (4).
2NaClO2 + Cl2 ⇌ 2ClO2 + 2NaCl
When chlorine dioxide is used in concert with ozone, chlorate is produced, which accumulates in seawater to toxic levels (5). To avoid this, the ozone is applied before the chlorine dioxide.
Ozone
Ozone, O3, is an unstable gas that must be generated on-site. The powerful oxidizing power of ozone can improve many water quality parameters besides disinfection, including the destruction of dissolved organic matter, controlling algae, color, and odor. Secondary oxidants produced by the ozonation of seawater include chlorine, bromine, chlorate and bromate. Ozone reacts rapidly with bromide ions to form hypobromite,
O3 + Br– ⇌ O2 + BrO–,
which then may react with ozone to form bromate, leaving no residual ozone.
O3 + BrO– ⇌ 2O2 + BrO3–
Analogous reactions produce hypochlorite and chlorate. Although there is significantly more chloride (19,400 mg/L) than bromide (65 mg/L) in seawater, ozone reacts at a slower rate with chloride ions, producing about 83 times more hypobromite than hypochlorite unless all the bromide ions are consumed (6). Since it takes about 39 mg/L ozone to oxidize all the bromide ions in seawater, bromide is unlikely to be completely consumed for most disinfection applications. The reaction rate of ozone with bromide ions consumes all the ozone in about 10 minutes or less. In addition, another source of ozone consumption at the pH of seawater is the reaction with hydroxide ions, OH–, to produce ionized hydrogen peroxide and oxygen.
O3 + OH– ⇌ (ionized) HO2– +O2
Therefore, residual ozone usually will not contribute to the TRO concentration.
Peracetic Acid/Hydrogen Peroxide
Peracetic acid is produced by the reaction between hydrogen peroxide and acetic acid, and maintains an equilibrium with them.
H2O2 + CH3COOH ⇌ CH3COOOH + H2O
In seawater peracetic acid produces the secondary oxidants chlorine and bromine, which may produce toxic DBPs. However, if the concentration of hydrogen peroxide is large enough it will reduce these secondary oxidants back to chloride and bromide ions, preventing or mitigating the formation of the DBPs (7).
Hydrogen Peroxide
A few parts per billion hydrogen peroxide occurs naturally in seawater from the photooxidation of organic matter (8). It degrades biotically due to an enzyme catalyzed reaction, and abiotically by a disproportionation reaction with itself, with transition metals, organic matter, free radicals and light. Although hydrogen peroxide has a larger oxidation potential than chlorine and bromine (Table 2) it reduces them to Cl– and Br–. It is often used as a dechlorination agent. Hydrogen peroxide is not known to react with bromide and chloride ions to form bromine and chlorine.
Ultraviolet Radiation
Ultraviolet radiation (UV) is light with wavelengths in the range of 100-400nm. It is divided into UVA (315-400nm), UVB (280-315nm) and UVC (100-280nm). Light in the UVC range transfers energy that is comparable to an oxidation reaction. It is commonly used for disinfection by causing disruptive reactions with the DNA of microorganisms. It also mineralizes organic matter by creating hydroxyl radicals (9).
Advanced Oxidation
Advanced oxidation processes (AOP) involve the production of hydroxyl radicals (OH*) by combining UV with hydrogen peroxide, titanium dioxide or ozone, or hydrogen peroxide and ozone (peroxone). Hydroxyl radicals are extremely unstable because one of the normally paired orbitals in the oxygen atom is missing an electron, and thus unpaired. To pair the orbital, it accepts an electron from another chemical, and is therefore an oxidant. It is capable of completely breaking down organic chemicals to their H2O and CO2 components (10).
Applications
Desalination
Desalination is a major source of fresh water in the Middle East and a significant source in many coastal cities throughout the world. The two methods of desalination are thermal processes (evaporation and condensation) and reverse osmosis/ultrafiltration (RO/UF) through a membrane. The desalination process begins with the pretreatment phase in which an oxidant is added to the seawater at the intake system to control biofouling. The water is then polished by coagulation and filtration, followed by destruction of the oxidant prior to desalination to protect the RO/UF membrane, if that is the method of desalination. During pretreatment, the important factors controlling DBP formation include the quality of the seawater and the choice of oxidant. While open ocean seawater is very uniform worldwide, coastal seawater may vary significantly in some components that may affect the formation of DBPs, like organic content and inorganic nitrogen, bromide and iodide ions. After desalination there is a final disinfection step, in which an oxidant is added prior to discharge through the distribution system. The degree of desalination is determined based on the application. Drinking water and irrigation water should be no greater than 450mg/L total dissolved solids (WHO). Often the desalinated water is mixed with other sources of freshwater to adjust the composition of the dissolved solids, particularly pH, hardness and alkalinity. If the added water contains significant amounts of organic matter, chloride, bromide or iodide ions, DBP formation may occur, depending on the choice of oxidant. The most commonly used oxidant for pretreatment and final disinfection is free chlorine, but other oxidants used include chlorine dioxide, chloramines and ozone (11). Chlorine dioxide has an advantage, especially in the pretreatment phase, because it will not oxidize bromide ions to bromine, avoiding the production of bromine DBPs, except in the presence of sunlight (12). However, it does introduce chlorite and chlorate, but by using extremely pure chlorine dioxide the concentrations of chlorite and chlorate can be kept below the WHO limits of 700 µg/L (13).
Ballast Water
Ships take up, transfer and discharge ballast water to maintain stability. It is usually composed of brackish to full strength seawater and contains any organisms that can pass through their filtration systems. Some of these organisms must be killed or inactivated to prevent them from infesting the locations where the ballast water is discharged. This is accomplished by the ballast water management system (BWMS). The International Convention for the Control and Management of Ships Ballast Water and Sediments (2004) under the International Maritime Organization (IMO) approves the ballast water management systems. However, US waters are governed by the United States Coast Guard (USCG) Final Rule (2012), which is more rigorous than the IMO rules. There are no international or US national regulatory limits for THMs or HAAs.

The BWMS is generally composed of a mechanism that either adds or electrolytically generates an oxidant based on the results of a DPD oxidant analyzer or electrode oxidant analyzer. The ballast water is dosed with enough oxidant to produce 1 to 15 mg/L TRO during transit (average 5 days), then neutralized to less than 0.1 mg/L TRO with sodium thiosulfate or sodium bisulfate before discharging. The required dose of TRO depends on the maximum allowable concentration of “active substances”, i.e., harmful organisms in the discharged ballast water (14). The oxidants include chlorine, chlorine dioxide, ozone, peracetic acid and hydrogen peroxide. Numerous commercial BWMS are available, e.g. Aqua Logistics Pte Ltd, Halogen Systems Inc., Alfa-Laval. Since the TRO content of ballast water tends to be measured periodically rather than continuously, it was found that the electrode measurement of TRO was less consistent than DPD measurement due to the equilibration requirements of the electrode with the sample (15). Besides chlorine and bromine, bromate and chlorate DBPs are also produced by both ozonation and electrolytic generation of chlorine in seawater. However, their formation can be reduced by adding hydrogen peroxide, which reacts with the chlorine and bromine converting them back to chloride and bromide (16). Increasingly sophisticated technologies are being applied to ballast water disinfection using advanced oxidation methods that generate hydroxyl radicals electrochemically (17) or with UV/hydrogen peroxide or UV/ozone (18).
Aquaculture/Aquaria/Fish Processing
Recirculating maricultural systems (RMS) are closed loop aquatic animal production tanks that are in wide use for marine aquaria. In RMS systems that use artificial seawater the bromine and bromate DBPs produced by ozone can be substantially reduced by simply excluding bromide from the artificial seawater mixture (19). However, in real seawater bromate production may preclude the use of ozone as a disinfectant for systems containing sensitive organisms. Chlorine dioxide is not suitable for RMS because it results in an unacceptable amount of chlorate accumulation (20). There are reviews of ozone in seawater aquaculture systems (21, 22). In the fish-processing industry hydrogen peroxide treated seawater was found to be more effective than chlorine or ozone at preventing biofilms in the distribution system because hydrogen peroxide could be used at much higher concentrations without adversely affecting the quality of life of the fish.

Saltwater Pool/Spa
Saltwater pools and spas contain about 1750-3500 mg/L sodium chloride. They have replaced most ocean pools, which were usually located on the coast and pumped seawater directly from the ocean. The disinfectant is produced by electrolytically converting chloride ions to chlorine.
Cooling Water
Cooling towers are used to dissipate waste heat into the environment. Investigators have compared the efficiency of different antifouling treatments for seawater cooling systems, including sodium hypochlorite, aliphatic amines, UV irradiation, chlorine dioxide and ozone (23, 24). While chlorine dioxide was the most effective biocidal oxidant at a low TRO dose of 0.1 mg/L ClO2, hypochlorite (23) and ozone (24) were more effective at higher doses. However, using chlorine dioxide to control biofouling in seawater cooling systems is promoted by water treatment manufacturers over other oxidants due to its minimal DBP production (Scotmas Group).
References
- Harp, Danial L. (2002) Current technology of chlorine analysis for water and wastewater. Technical Information Series – Booklet No. 17.
- J. Plewa. Et al (2010) Mammalian cell cytotoxicity and genotoxicity of the haloacetic acids, a major class of drinking water disinfection byproducts. Environmental and Molecular Mutagenesis, V51, 871-8.
- Adenekan et al (2009) Transport and Fate of chlorinated By-Products Associated with Cooling Water Discharges, Proceedings of the 1st Annual Gas Processing Symposium.
- Gorden and S. Tachiyashlhl, Kinetics and mechanism of formation of chlorite ion from the hypochlous acid/chlorite ion reaction at pH 6-10. ES&T (1991) V25, 468-74.
- Gordon and B. Bubnis, Ozone and chlorine dioxide: Similar chemistry and measurement issues. The Journal of the International Ozone Association (1999) V21, 447-64.
- Jung et al., A kinetic study of ozone decay and bromine formation in saltwater ozonation: effect of O3 dose, salinity, pH and temperature, Chem. Eng. J. (2017) V312, 30-38.
- Shah et al (2015) Peracetic acid oxidation of saline waters in the presence and absence of H2O2: Secondary oxidant and disinfection byproduct formation, ES&T V49, 1698-1705.
- Moffett and O. Zafiriou, An investigation of hydrogen peroxide chemistry in surface waters of Vinyard Sound with H218O2 and 18O2 (1990) Limnology and Oceanography, V35, 1221-9.
- Penru et al (2012) Application of UV and UV/H2O2 to seawater: Disinfection and natural organic matter removal. Journal of photochemistry and photobiology A: Chemistry, V233, 40-45.
- Negarash, et. Al (2018) Potential for the formation of disinfection by-products from advanced oxidation processes. Report DWI 12852.02.
- Kim et al (2015) Disinfection By-products formation during seawater desalination: A Review, Water Research V81 343-355.
- Dasani et. Al (2007) Chlorine dioxide disinfection technology to avoid bromate formation in desalinated seawater in potable waterworks, Desalination V203, 312-18.
- Palacios and A. Martorell (2015) Chlorine Dioxide as Disinfectant for Pretreatment in Seawater Desalination Plants, AWWA/AMTA Conference in Orlando FL.
- Kim et al., Consideration on the maximum allowable dosage of active substances produced by ballast water management system using electrolysis. International Journal of e-navigation and maritime economy (2016) V4, 88-96.
- Zimmer-Faust, et al (2014) Evaluation of approaches to quantify total residual oxidants in ballast water management systems employing chlorine for disinfection, Water Science and Technology, V10, 5-93].
- Jung et al (2014) Formation of bromate and chlorate during ozonation and electrolysis in seawater for ballast water treatment, Journal of IOA, V66, 215-25.
- Moreno-Andres et al (2018) Inactivation of marine heterotrophic bacteria in ballast water by an electrochemical advanced oxidation process, Water Research, V140, 377-86.
- Moreno-Andres et al (2017) UV-based technologies for marine water disinfection and application to ballast water: Does salinity interfere with disinfection processes? Science of the Total Environment, V581-2, 144-52.
- Qiang et al., Formation of disinfection byproducts in a recirculation mariculture system: Emerging concerns. Environmental Science: Processes and impacts (2015) V17, 471-7.
- Wang et al (2018) Characterization of Brominated Disinfection Byproducts Formed during the Disinfection of Aquaculture Seawater, ES&T V52, 5662-70.
- Concalves and G. Gagnon, Ozone applications in recirculation aquaculture systems: An overview. (2011) Ozone Science and Engineering, chlorine dioxide
- Summerfelt and J. Hochheimer, Review of ozone processes and applications as an oxidizing agent in aquaculture. (1997) The progressive fish culturist V59, 94-105.
- Efficiency of different antifouling treatments for seawater cooling systems (2010) Cristinia Lopez-Galindo, et. Al, The Journal for Bioadhesion and Biofilm Research, V26, 923-30.
- Albloushi (2018) Performance assessment of oxidants as a biocide for biofouling control in industrial seawater cooling towers. J. Industrial and Engineering Chem. V59, 127-33.
CHEMetrics loves the Chesapeake, so we are especially excited to meet our Chesapeake neighbors at the 2021 Mid-Atlantic Utility Conference. Stop by Table #30 at the Turf Valley Resort in Ellicott City, Maryland November 9-10 this week to see how we’re all about Simplicity in Water Analysis. We look forward to seeing everyone there!
We’re excited to be exhibiting in person at WaterPro 2021 in magnificent Milwaukee (Sept. 13 – 16). Stop by booth #1117 to check out our test kits and a demonstration, or to pick up a free bag and catalog. Can’t wait to see everyone there!

Water Alkalinity
The alkalinity of water is a measurement of its buffering capacity, which is its ability to neutralize acid or to resist acidification. In contrast, pH is a logarithmic scale for expressing Hydrogen (H+) ion concentration. A solution of pH 7.0 is considered to be neutral, whereas a solution above pH 4.5 is considered to have alkalinity.

Figure 1: The geology around natural waters will affect alkalinity.
Alkalinity of natural waters is comprised of a combination of bicarbonate, carbonate, and hydroxide ions, the proportions of which vary depending on pH. Bedrock (typically limestone), soil type, weathering processes, and precipitation will influence the predominant form of alkalinity. For example, waters flowing through limestone regions tends to have a higher alkalinity than waters flowing through granite, conglomerate, and sandstone regions.
As pH rises, more bicarbonate will change to carbonate. Sewage and wastewaters usually exhibit higher alkalinities due to the presence of silicates and phosphates. Bicarbonate and hydroxide alkalinity cannot coexist in general terms and occur at different pHs. At pH 7, the proportion of carbonate is very small.
| pH | Composition |
| 1.0 – 4.5 | Free mineral acidity, CO2 escapes (i.e. no HCO3–, CO3=) |
| 4.5 – 9.6 | Bicarbonate alkalinity (HCO3–) |
| 8.3 – 14.0 | Carbonate alkalinity (CO3=) |
| 9.5 – 14.0 | Hydroxide alkalinity (OH–) |
At or below pH 4.5, all bases have been reduced to water and carbon dioxide. Waters between pH 4.5 and 8.3 contain weak acids such as carbonic acid, and below pH 4.5 contain mineral acids. Carbon dioxide and carbonic acid exist in a chemical equilibrium in solution.
Phenolphthalein alkalinity is the sum of all carbonate (CO3=), bicarbonate (HCO3–) and hydroxide (OH–) alkalinity above pH 8.3. Hydrate Alkalinity, on the other hand, is simply the hydroxide (OH–) component of alkalinity above pH 8.3.
How to Measure Alkalinity
Water alkalinity is measured by titrating a sample with a strong acid to a designated titration endpoint. The endpoint is commonly determined using pH (visual) indicators. Alternatively, a pH meter may be used.
Both bromocresol green / methyl red and phenolphthalein indicators are specified in the American Public Health Association (APHA)’s Standard Methods, Method 2320 B for the determination of total alkalinity and phenolphthalein alkalinity, respectively.
Water alkalinity is expressed in terms of its base concentration, usually as equivalent mg/L CaCO3. There are three main forms of alkalinity that are distinguished by their endpoints:
| Type | pH Indicator | Definition |
| Total Alkalinity (T or M) | Bromocresol Green / Methyl Red | Alkalinity above pH 4.5 |
| Phenolphthalein Alkalinity (P) | Phenolphthalein | Alkalinity above pH 8.3 |
| Hydrate Alkalinity (OH) | Phenolphthalein | Hydroxide Alkalinity above pH 8.3 |
Below pH 4.5 there is said to be no total alkalinity; below pH 8.3 there is said to be no phenolphthalein or hydrate alkalinity.
The term ‘alkalinity’ is usually used to refer to total alkalinity (T alkalinity) or methyl orange alkalinity, otherwise known as M alkalinity. Phenolphthalein alkalinity is usually abbreviated to P alkalinity. Hydrate alkalinity is also known as hydroxide alkalinity, OH alkalinity, or just O alkalinity.
CHEMetrics offers three Total Alkalinity Titrets® Test Kits employing bromocresol green/methyl red pH indicators to deliver sensitivity and accuracy within minutes, covering the ranges 10-100 ppm (K-9810), 50-500 ppm (K-9815), and 100-1000 ppm CaCO3 (K-9820).
Titrets ampoules use a reverse titration technique to measure analyte concentration levels. This means that the titrant volume inside the ampoule is fixed while the sample volume is varied. After snapping the ampoule tip, sample is drawn into the test ampoule in small doses until a color change signals that the endpoint has been reached. The titration is stopped at the endpoint, and the liquid level in the ampoule corresponds to the concentration printed on a scale on the ampoule’s outer surface.
The endpoint of the titration for CHEMetrics’ tests for alkalinity in water is signaled by a color change from pink to bright green. If the test ampoule is filled with sample but remains pink, the total alkalinity is below the test range. If the solution changes to bright green immediately upon introduction of the first small dose of sample, the total water alkalinity is above the test range. If the sample itself turns pink immediately upon addition of the indicator (activator) solution (prior to introduction of the sample into the test ampoule), the sample pH is less than or equal to 4.5, which indicates that the alkalinity of the sample is 0 ppm.
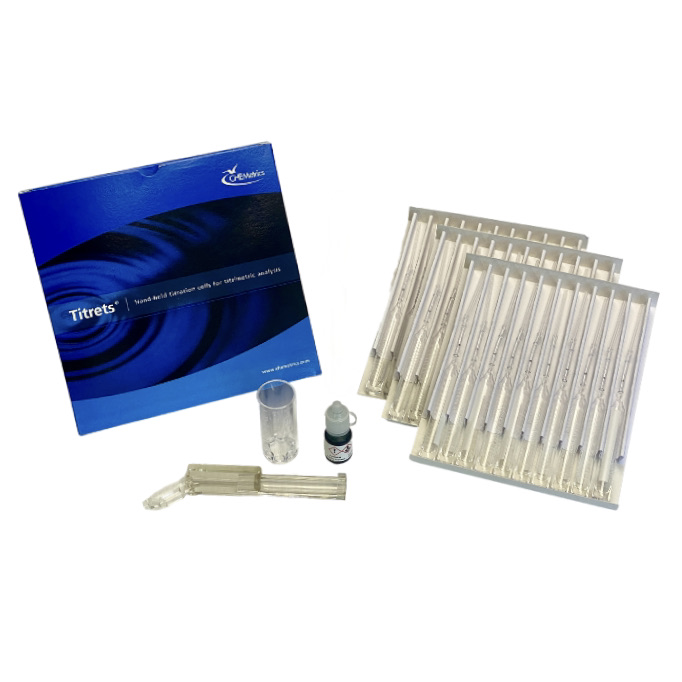
Figure 2: CHEMetrics Alkalinity Titrets Test Kit
Alkalinity Calculations
By determining both the T and P alkalinity values of a sample, an analyst can calculate the individual concentrations of CO3=, HCO3– and OH–, which are the components that are typically attributed to a sample’s alkalinity using the table below. This table presupposes incompatibility of OH– and HCO3– alkalinities, which is essentially correct, although there is actually a slight overlap in pH transition between the two. We also offer an easy concentration calculator, which is compatible with all CHEMetrics instrumental test kits.
T Alkalinity ≈ 2 [CO3=] + [HCO3–] + [OH–]
| Titration Result |
OH– Alkalinity as CaCO3 |
CO3= Alkalinity as CaCO3 |
HCO3– Alkalinity as CaCO3 |
| P=0 | 0 | 0 | T |
| P<0.5T | 0 | 2P | T-2P |
| P=0.5T | 0 | 2P | 0 |
| P>0.5T | 2P-T | 2(T-P) | 0 |
| P=T | T | 0 | 0 |
Source: APHA Standard Methods, 22nd ed., Method 2320 B: Table 2320:II (1997).
Patrik Askert, Galgo, May 2019
Edited by CHEMetrics, August 2021
References:
- APHA (1997). Standard Methods, 22nd ed., Method 2320 B. Washington DC: APHA.
- CHEMetrics (2018). Total Alkalinity Titrets Kit Instructions. Rev.11. Midland, VA: CHEMetrics, LLC
We’re proud to be exhibiting at this week’s big Aquaculture America 2021, presented by the World Aquaculture Society, in San Antonio from August 11-14, 2021. Swing by the CHEMetrics booth (#316) so we can give you a product demo and show you first-hand how our colorimetric test kits can meet your water analysis needs. See you by the Alamo!
-Zachary Waszczak, August 2021
CHEMetrics is honored to be a part of the debut ‘Stand Ready’ webinar created and hosted by our colleagues at Sentry Equipment. The first topic is one of the most important: Monitoring and control of dissolved oxygen is critical for boiler operators since even low concentrations can be destructive, causing localized corrosion and pitting.
Watch Sentry’s video to learn more about DO monitoring, then be sure to check out https://bit.ly/CHEMforDO for your dissolved oxygen testing needs. Also visit https://bit.ly/SentrySWAS to learn more about sample and analysis systems.
Significance of Dissolved Oxygen in Aquatic Environments
Measuring the concentration of dissolved oxygen (DO) in natural waters is vital in assessing the overall health of aquatic environments. While every ecosystem is different, water bodies need approximately 6 – 10 mg/L (ppm) DO to support aquatic life. Low dissolved oxygen concentration is a strong indicator that sources of pollution are negatively impacting water quality. Often, low levels of DO can be traced to non-point sources such as stormwater runoff. Typical contaminants stemming from runoff are petroleum hydrocarbons and excess fertilizer which supplies plant nutrients that create algae blooms. As the algae decompose the oxygen in the water is consumed causing hypoxia (low levels of DO) or anoxia (complete absence of DO). In a healthy water environment, oxygen can be replenished in the water naturally through the atmosphere and photosynthesis by aquatic plants. Flowing water such as streams and rivers will have greater levels of DO due to natural aeration of the water caused by agitation.
Oxygen solubility in water is dependent upon temperature, atmospheric pressure, and salinity of the water. When assessing the dissolved oxygen concentration in a body of water, it is important to consider all of these factors. Oxygen solubility is often expressed in terms of percent (%) air saturation. Air saturation tables provide theoretical values of dissolved oxygen at 100% air saturation at various temperatures and air pressures.
Testing for Dissolved Oxygen in the Field
Various types of dissolved oxygen measurement equipment are commercially available that utilize galvanic, polarographic, and optical sensors. These probes are reliable but require calibration and maintenance which may not always be cost effective for certain kinds of project specific monitoring requirements.
Test kits are a lower cost option than probes but may require multiple steps to obtain test results. Many test kits on the market today utilize an older method called the Winkler Titration. CHEMetrics offers test kits that employ the simpler but equally reliable indigo carmine method. A comparison study was conducted between CHEMetrics K-7513 Vacu-vials® and K-7512 CHEMets® test kits (indigo carmine method) and LaMotte’s 5860-01 test kit (Winkler Titration).
What is the Winkler Titration?
The Winkler Test, also referred to as the Winkler Titration or the Iodometric Method, was created by Lajos Winkler in 1888 while working on his dissertation at Budapest University. The method is broken down into a few steps that can be altered with slightly different chemicals. The first step is the fixation of oxygen in the sample. For the LaMotte 5860-01 kit, manganous sulfate, MnSO4, and an alkaline potassium iodide azide solution are added to the sample. This creates a white precipitate of manganous hydroxide, Mn(OH)2. Once the precipitate is formed, oxygen in the water oxidizes an equivalent amount of Mn(OH)2 to a brown precipitate called manganic hydroxide, Mn(OH)3. A strong acid, commonly sulfuric acid, is added to acidify the solution. The acid converts the Mn(OH)3 to manganic sulfate, Mn2(SO4)3. After this step, because the oxygen within the sample is “fixed,” additional atmospheric oxygen being introduced to the sample is unlikely to interfere with the test result. The manganic sulfate oxidizes potassium iodide to form iodine. The amount of iodine released is proportional to the amount of oxygen present in the sample. The release of iodine changes the color of the sample to a yellow-brown color. The final step is to determine the amount of iodine in the sample by titrating with sodium thiosulfate (Na2S2O3). When the iodine has been completely converted into sodium iodide (NaI) the solution will turn colorless. It is not uncommon for an indicator to be added to make the final endpoint easier to determine.

The LaMotte 5860-01 test kit utilizes the Winkler method for Dissolved Oxygen analysis.
What is the Indigo Carmine Method?
CHEMetrics K-7512 CHEMets (visual) and K-7513 Vacu-vials (instrumental) dissolved oxygen test kits are based on the Indigo Carmine Method and self-filling ampoule technology. The indigo carmine method utilizes the reduced (or leuco) form of the indigo carmine dye which is yellow. When this form of indigo carmine reacts with oxygen, it changes from a yellow green to a blue color. The intensity of the blue color is directly proportional to the concentration of dissolved oxygen in the water sample.

CHEMetrics K-7512 visual test kit utilizes indigo carmine method for Dissolved Oxygen Analysis
The indigo carmine reagent is packaged inside CHEMetrics glass ampoules sealed under vacuum. The analyst snaps the ampoule tip in the water sample prompting sample to be drawn into the ampoule. When the ampoule is inverted, the bubble mixes the reagent with the sample. After a 2-minute color development time, K-7512 CHEMets ampoules are read in a color comparator where the intensity of the blue color developed in the test ampoule is visually compared against color standards representing DO concentrations ranging from 1 – 12 mg/L (ppm). Likewise, K-7513 Vacu-vials ampoules can be read in spectrophotometer at 485 nm in absorbance mode. CHEMetrics provides a calibration equation to convert absorbance to ppm DO. Alternatively, K-7513 Vacu-vials ampoules can be read in CHEMetrics pre-calibrated photometers that display direct ppm DO test results ranging from 2 – 15 ppm.
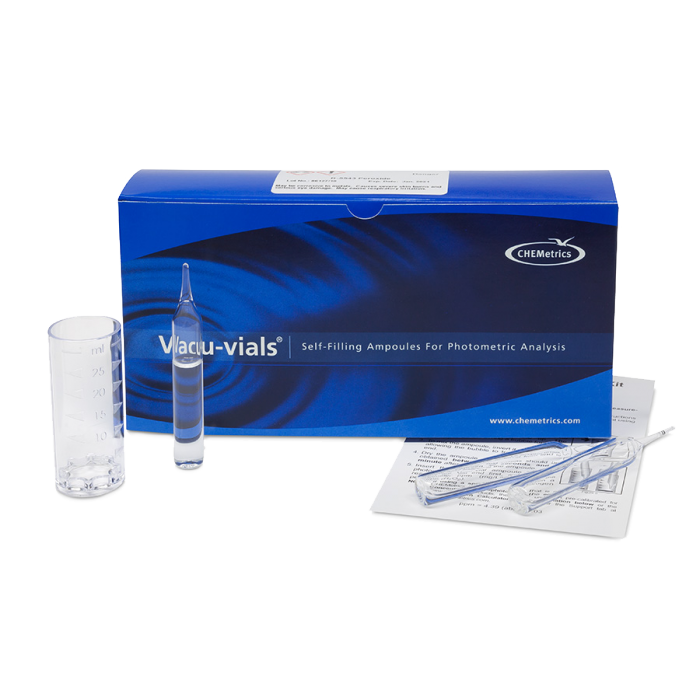
CHEMetrics K-7513 Is an instrumental version of the indigo carmine method for Dissolved Oxygen analysis.
Unlike the Winkler method, the CHEMetrics indigo carmine test procedure is simple, fast and does not require measuring and adding multiple reagents to the sample to complete the required chemical reactions. Therefore, the test can easily be performed immediately at the time of sample collection, minimizing the opportunity for atmospheric oxygen to enter the sample. Furthermore, the K-7512 and K-7513 test kits are not susceptible to interferences from temperature, salinity, or dissolved gases like sulfide. The ease of this method makes it especially convenient for environmental water analysis.
Comparing Performance of Winkler and Indigo Carmine Dissolved Oxygen Test Kits
A protocol was designed to compare test results generated by the two methods. Oxygen in nitrogen gas standards representing two levels of oxygen were bubbled into a 2-liter separatory funnel containing deionized water. The concentration of dissolved oxygen was determined from the application of Henry’s Law, the barometric pressure, and water temperature. The sampling bottle provided with the LaMotte’s 5860-01 was filled with sample from the separatory funnel. This sampling technique was found to be a more reliable procedure in a lab setting than the submerged bottle method suggested by the LaMotte kit instructions. Once the LaMotte bottle was filled, the LaMotte test procedure was followed. Both the K-7512 CHEMets and the K-7513 Vacu-vials ampoules were snapped while the sample continually flowed into a beaker. A spectrophotometer was used to measure K-7513 absorbance values. An I-2002 CHEMetrics Single Analyte Meter (SAM) was used for a second set of instrumental readings. Two DO concentrations were evaluated, 4.0 and 10.7 ppm. The results of the testing are displayed below.
CHEMetrics vs. Winkler test results

Results
Test results agreed favorably among the LaMotte and CHEMetrics instrumental and visual test kits. At 4.0 ppm DO, less than 1 ppm error was observed with both the Winkler and the indigo carmine methods. At 10.7 ppm DO, both methods performed similarly with errors ranging between -1.1 and 0.3 ppm DO. K-7513 test results were consistent between the spectrophotometer and I-2002 SAM photometer.
Conclusion
Measuring dissolved oxygen is critical to understanding the health of aquatic environments. There are many ways to analyze dissolved oxygen, such as probes and test kits. Many test kits offer the Winkler titration method which is labor intensive and complicated, requiring addition of multiple chemicals. CHEMetrics offers an indigo carmine method packaged in our self-filling ampoules to create a simplified testing procedure. It can be used to obtain accurate results with fewer steps and less chemical handling than with the Winkler method. The ease of use and portability of the CHEMetrics test kits and I-2002 SAM photometer make them perfect for testing in the field. To purchase CHEMetrics test kits or find more technical information about the K-7512 and K-7513 test kits, please explore our dissolved oxygen test kits.
Zachary Waszczak, July 2021
References
- EPA National Aquatic Resource Surveys Indicators Dissolved Oxygen. https://www.epa.gov/national-aquatic-resource-surveys/indicators-dissolved-oxygen (accessed Apr 12, 2021)
- Dissolved Oxygen (DO), Government of Northwest Territories Environment and Natural Resources. https://www.enr.gov.nt.ca/sites/enr/files/dissolved_oxygen.pdf (accessed Apr 12, 2021)
- LaMotte Dissolved Oxygen Water Quality Test Kit Instruction Manual Code 5860-01.
Welcome to newly renovated CHEMetrics Newsroom! We have reworked this space to make it easier for you to find our latest articles and announcements. Don’t worry, your favorite articles are still here, just organized into new categories that you see on the right. Check back regularly to find the latest news and insightful articles from CHEMetrics.
CHEMetrics for Simplicity in Water Analysis.
-Zachary Waszczak, June 2021
What is DEHA?
Dissolved oxygen in boiler system water causes corrosion and pitting of metal surfaces, which can lead to boiler inefficiency, equipment failure, and system downtime. N,N-Diethylhydroxylamine (C2H5)2NOH, or DEHA, is a volatile amine commonly used for oxygen scavenging in a variety of boiler systems. Hydrazine was once in widespread use as a boiler treatment chemical with oxygen scavenging and surface passivating properties. When hydrazine was found to be toxic in the early 1970’s, DEHA became a favored replacement because of its lower toxicity and beneficial chemical properties.

Why Use DEHA in Boiler Systems?
DEHA has many chemical properties that make it an excellent oxygen scavenger for high or even medium pressure boilers. However, it is not as efficient in low pressure boilers due to the low reaction rate at lower pressure and temperatures. The volatile nature of DEHA allows it to be distributed not only by water but also by steam throughout the condensate system. This enables more complete boiler system protection.
In addition to being a powerful oxygen scavenger, DEHA also promotes the passivation of low carbon steel by converting hematite (red rust) to a black magnetite layer that protects metal surfaces from further corrosion.
DEHA degrades into two neutralizing amines within a boiler system: diethylamine and ethylmethylamine. These neutralizing amines raise the pH of the condensate and thus reduce the need to treat with additional neutralizing amines.
DEHA also helps prevent corrosion and control dissolved oxygen levels in wet lay-up scenarios. It is usually added alongside morpholine during wet storage of a boiler. Together these chemicals help maintain pH and prevent corrosion during the lay-up.
How Do I Test For DEHA?
Currently there is no published standardized method or procedure to test for DEHA in boiler feedwater or condensate. However, a modification to a ferrous iron colorimetric test is commonly used to measure low levels of DEHA. In the PDTS method, the sample is treated with an excess of ferric iron which is reduced to ferrous iron by DEHA. The ferrous iron then reacts with the indicator PDTS [3-(2-pyridyl)-5,6-bis(4-phenylsulfonic acid)-1,2,4,-triazine disodium salt] to form a pink-purple colored complex in direct proportion to the concentration of DEHA.
CHEMetrics DEHA Test Kits
CHEMetrics offers both visual and instrumental PDTS test kits for analysis of DEHA in water, applying the company’s vacuum-sealed ampoule technology. The test method is streamlined and does not involve transfer of sample from one container to another. The CHEMets® K-3902 visual test kit offers 0-400 ppb and 400-3,000 ppb-range comparators. For analysts seeking an instrumental test, the K-3903 Vacu-vials® kit measures DEHA in the 0-2.00 ppm range and may be used with CHEMetrics Direct-Readout Photometers or a spectrophotometer capable of accepting a 13 mm diameter round cell.

CHEMetrics also offers a titrimetric high range DEHA test kit for boiler lay-up applications. K-3925 employs a ceric sulfate titrant and ferroin end point indicator to measure DEHA from 25 to 250 ppm.
Each test kit supplies everything needed to conduct 30 tests. For more information, please visit the DEHA Test Kits page.
-Zachary Waszczak, April 2021
Sources:
- Brenner, Michael. How Steam Chemistry and Control Affect Steam Side Coil Corrosion; Western Dry Kiln Association, May 2004.
- Kasinecz, Frank. Diethylhydroxylamine (DEHA): A Volatile Oxygen Scavenger for Boiler System Treatment; The Analyst (2001 Winter).
- Khera, Anil; Anbananthan, N. Diethyl Hydroxylamine as Oxygen Scavanger For Boiler Water Treatment; Ion Exchange India Ltd.
- CHEMetrics Inc.; Version 4, Mar 2018, DEHA – PDTS Method Technical Data Sheet, Midland VA.
Listen to episode #178 of the Words on Water podcast to hear CHEMetrics R&D Director Joanne Carpenter and Katie Bell of Brown and Caldwell discuss the rise of peracetic acid and how it has become a disinfection alternative to UV and chlorine at water resource recovery facilities. Thanks to the Water Environment Federation (WEF) for producing another great episode. Don’t forget to check out our peracetic acid test kits for your testing needs.

Left: CHEMetrics Director of R&D Joanne Carpenter. Right: Katie Bell Director of Water Strategy for Brown and Caldwell.
–Grant Rampy, Zachary Waszczak March 2021